Getting started
Quick start
Go from a fresh account to your first analytics in about ten minutes. Each step below links to a deeper guide if you want the details.
Add brand
Name + aliases
Add questions
What buyers ask AI
Add competitors
Who you're measured against
Run
Query the AI engines
Read
Your first analytics
1 · Set up your brand
- 1
Create an account
Sign up and you land in a three-step onboarding wizard. You can skip any step — everything can be added later from the dashboard.
- 2
Add your brand
Enter the brand name you want to monitor, plus aliases (comma-separated variants like “GEOX”, “geox.fun”) so mentions are caught even when phrased differently. An optional URL and description give the analysis extra context.
- 3
Add questions
Write the real questions a customer might ask an AI about your category — for example “What are the best GEO monitoring tools?”. These are what the engines will actually be asked. Three to ten questions is a good start.
- 4
Add competitors
Name the rivals you want to be measured against, with their aliases. This powers the competitor share and gap analysis. Click Finish and you land on Brand Exposure.
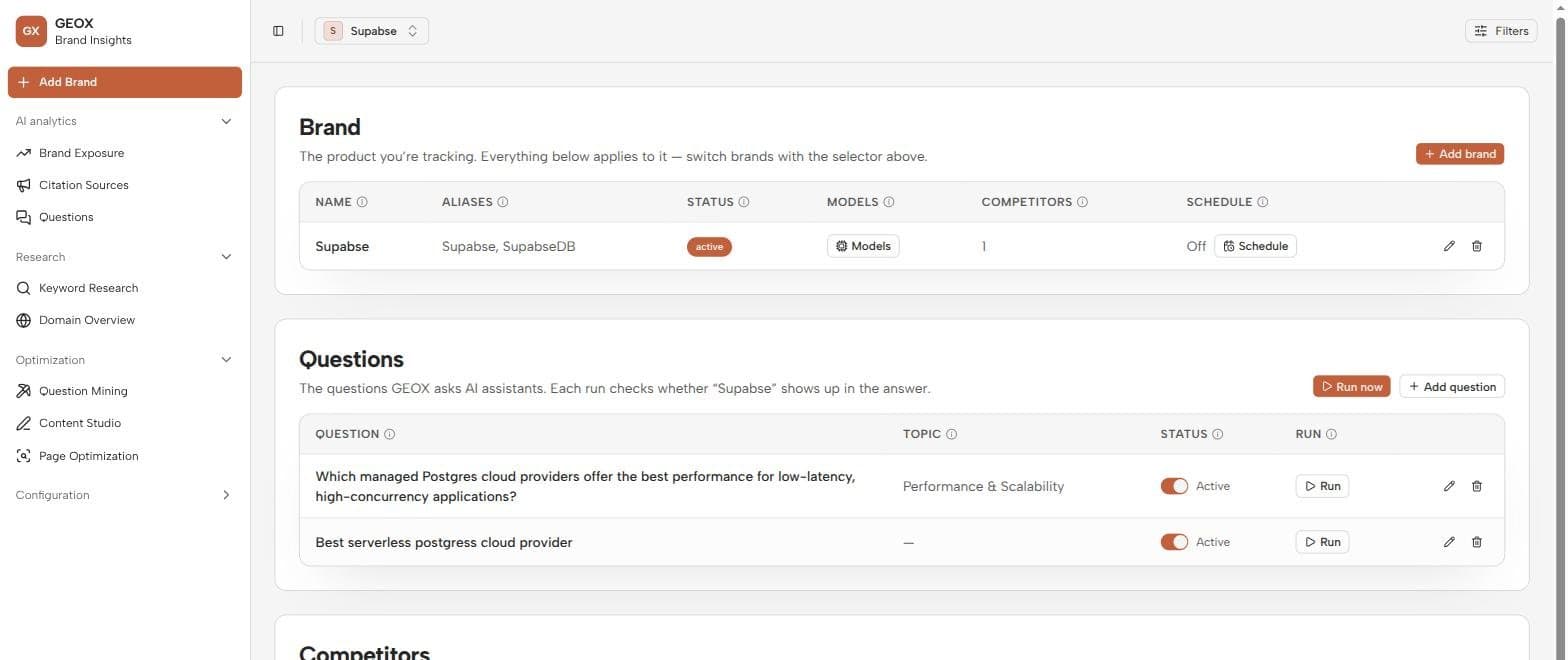
Later you can add more brands anytime with the + Add Brand button at the top of the sidebar, and switch between them with the brand selector in the top bar.
2 · Run your first collection
- 1
Press “Run now”
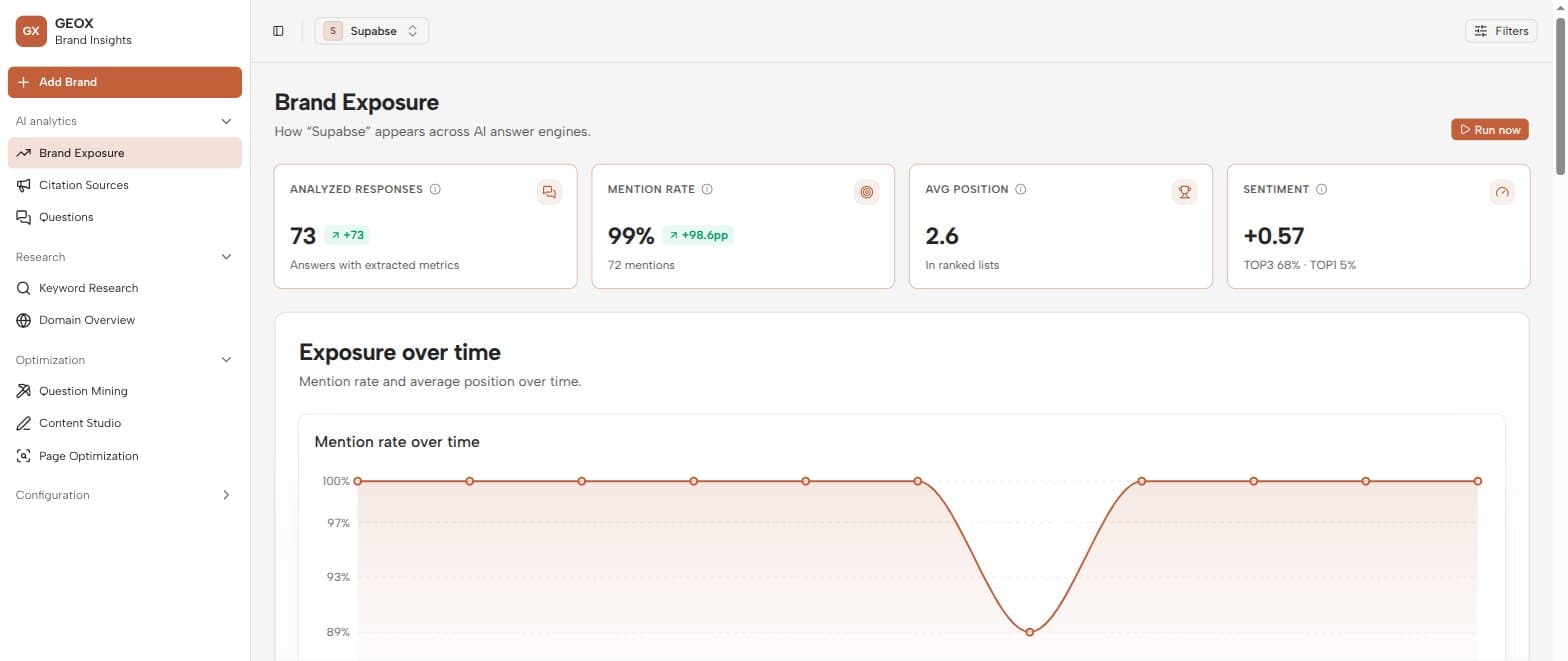
On Brand Exposure (or on the Brands page), click Run now. GEOX sends every active question to each AI engine enabled for the brand and stores the answers verbatim.
- 2
Wait for the toast
Runs hit live models, so they take a moment. The run indicator in the top bar shows progress, and a toast confirms when collection finishes. Metrics land shortly after — they come from a second analysis pass over the raw answers.
- 3
Read the results
Brand Exposure now shows your mention rate, average position, and sentiment, with platform and competitor breakdowns further down the page. The Questions page lists every individual answer.
3 · Put it on a schedule
One run is a snapshot; trends need repetition. On the Brands page, open the clock icon on your brand row and pick a cadence — daily, weekly, monthly, or a one-time run — at a time in your local time zone. GEOX then collects on its own and your charts fill in over time.
4 · Start improving
Once you can see where you stand, the Optimization pages tell you what to do about it:
- 1
Mine more questions
Question Mining expands a seed topic into the questions buyers actually ask. Track the promising ones and they join your monitored set automatically.
- 2
Create citation-ready content
Content Studio generates or rewrites content engineered to be quoted by AI engines, graded 0–100 by the GEO score.
- 3
Test your pages
Page Optimization asks the engines your tracked questions for real and shows whether a specific page of yours gets cited — plus the technical fixes (JSON-LD, llms.txt, crawler access) when it doesn’t.
- 4
Work the backlog
Every insight has an “add to tasks” action. Tasks ranks them by impact ÷ effort so the biggest win for the least work is always on top.
Empty analytics?
Adding a question only configures it — you must run a collection before any analytics appear. If numbers still look sparse right after a run, give the analysis pass a moment and refresh.